Rosetta Ingest 
Rosetta Ingest enables the user to keep in control of a mapping layer between their existing systems, databases and message formats and the format underpinned by a model. The main artefact of the mapping layer is called the Translation Dictionary, which is created thanks to Rosetta Ingest.
Rosetta Ingest also offers a universal API to ingest and normalise the user data, by leveraging on the mapping layer that is created thanks to Rosetta Ingest.
In this section, you will learn about:
- Ingestion
- Exploring the file - Synonym Sources and test packs
- File Management
- Running Ingestion
- Viewing the results
This section uses examples extracted from the Demonstration Model, a model based on vehicle taxonomy which is used for tutorial and training. Users are invited to refer to the Mapping Section of the Rosetta DSL documentation for further details on how mappings are implemented.
Ingestion 
In Rosetta, Ingestion is the process of converting an (electronic) input file into the format underpinned by a model.
The input file can be one of different standard formats for electronic data storage and transport, such as XML or JSON.
Exploring the files - Synonym Sources and Test packs 
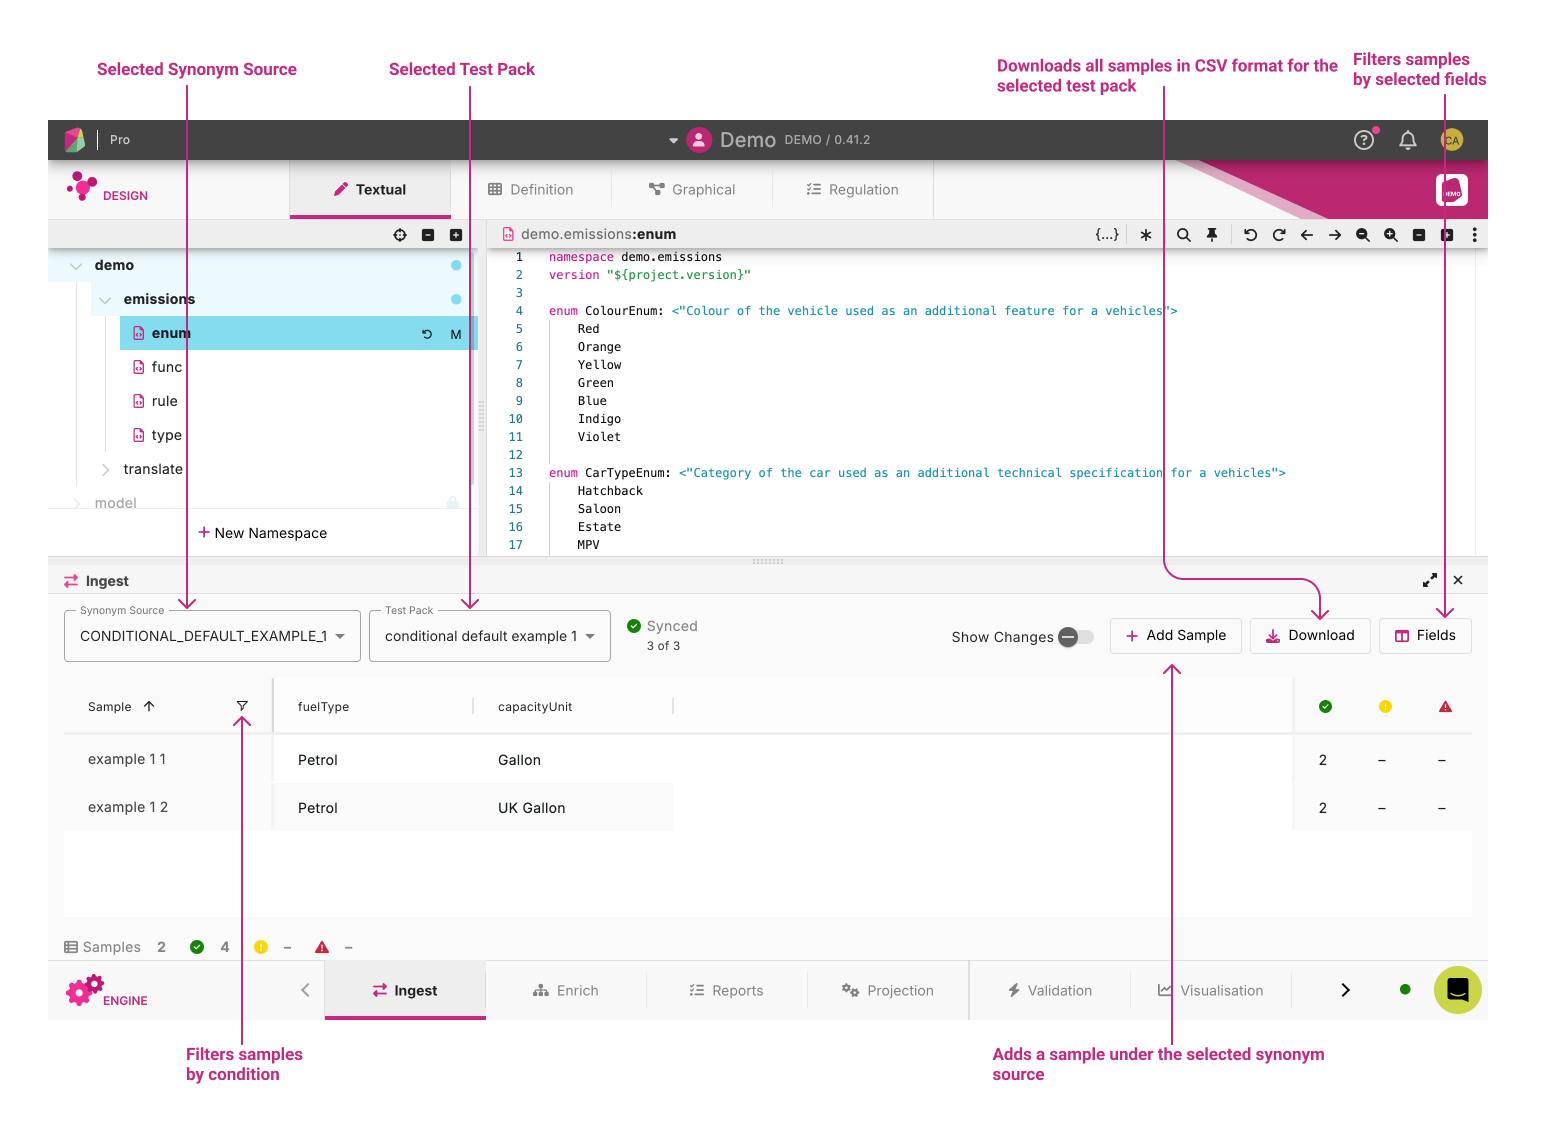
Located in the top right of the ingest panel, the two dropdowns, Synonym Source and Test Packs allows the user to interact with sample files which are specific to the loaded Workspace.
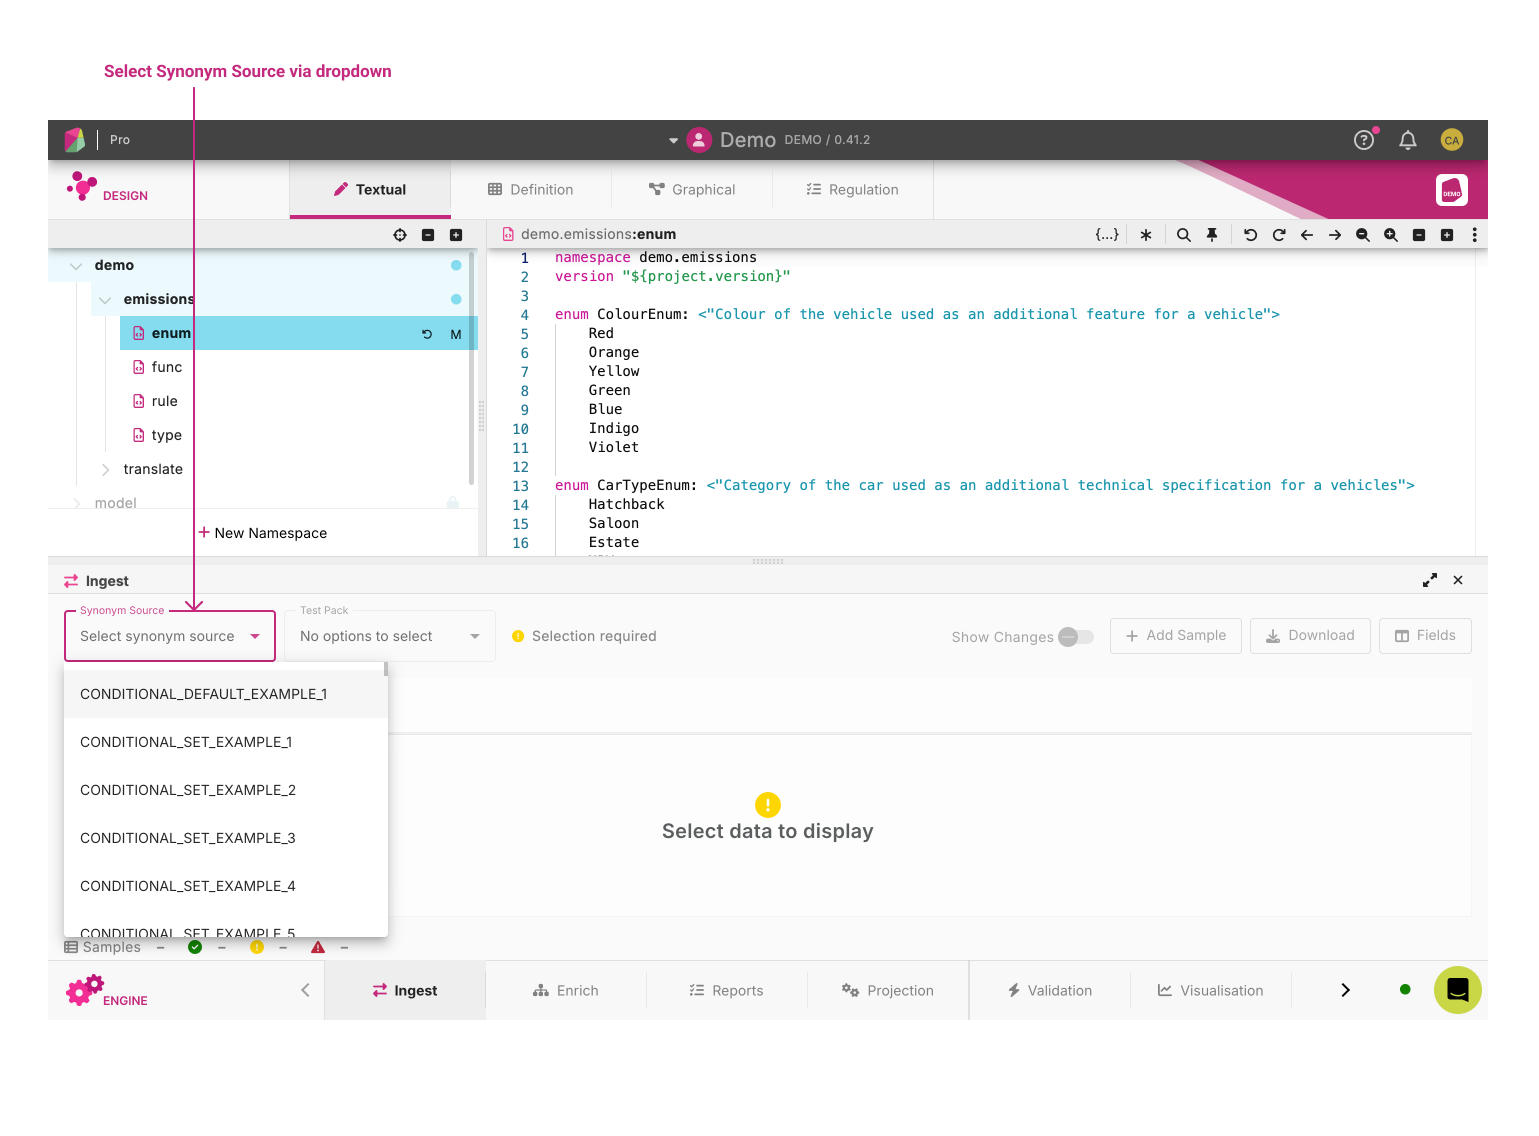
Synonym Sources are namespaces in Rosetta that are used to define translation from an XML input to Rosetta objects.
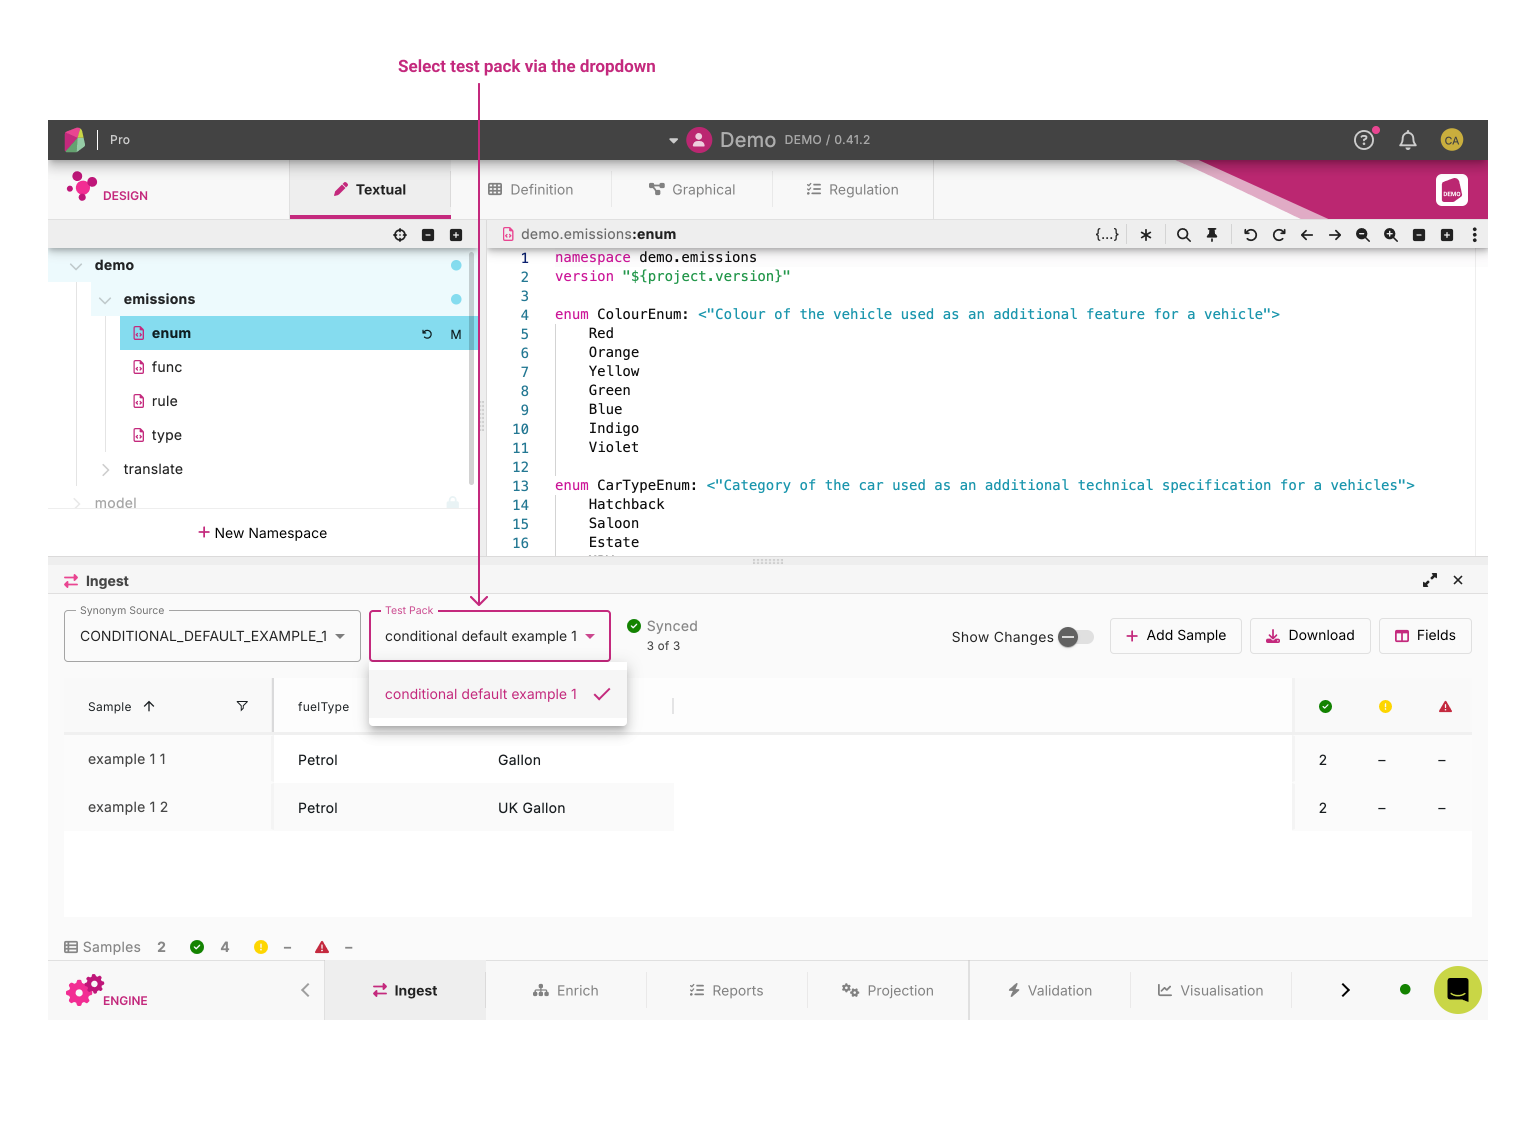
Test packs are groups of samples that are used to test against model changes.
Selecting a Synonym source will default the test pack to the first available test pack. Users can then select any additional test packs they may wish to run.
Filters 
Ingest supports filters to limit which samples are displayed.
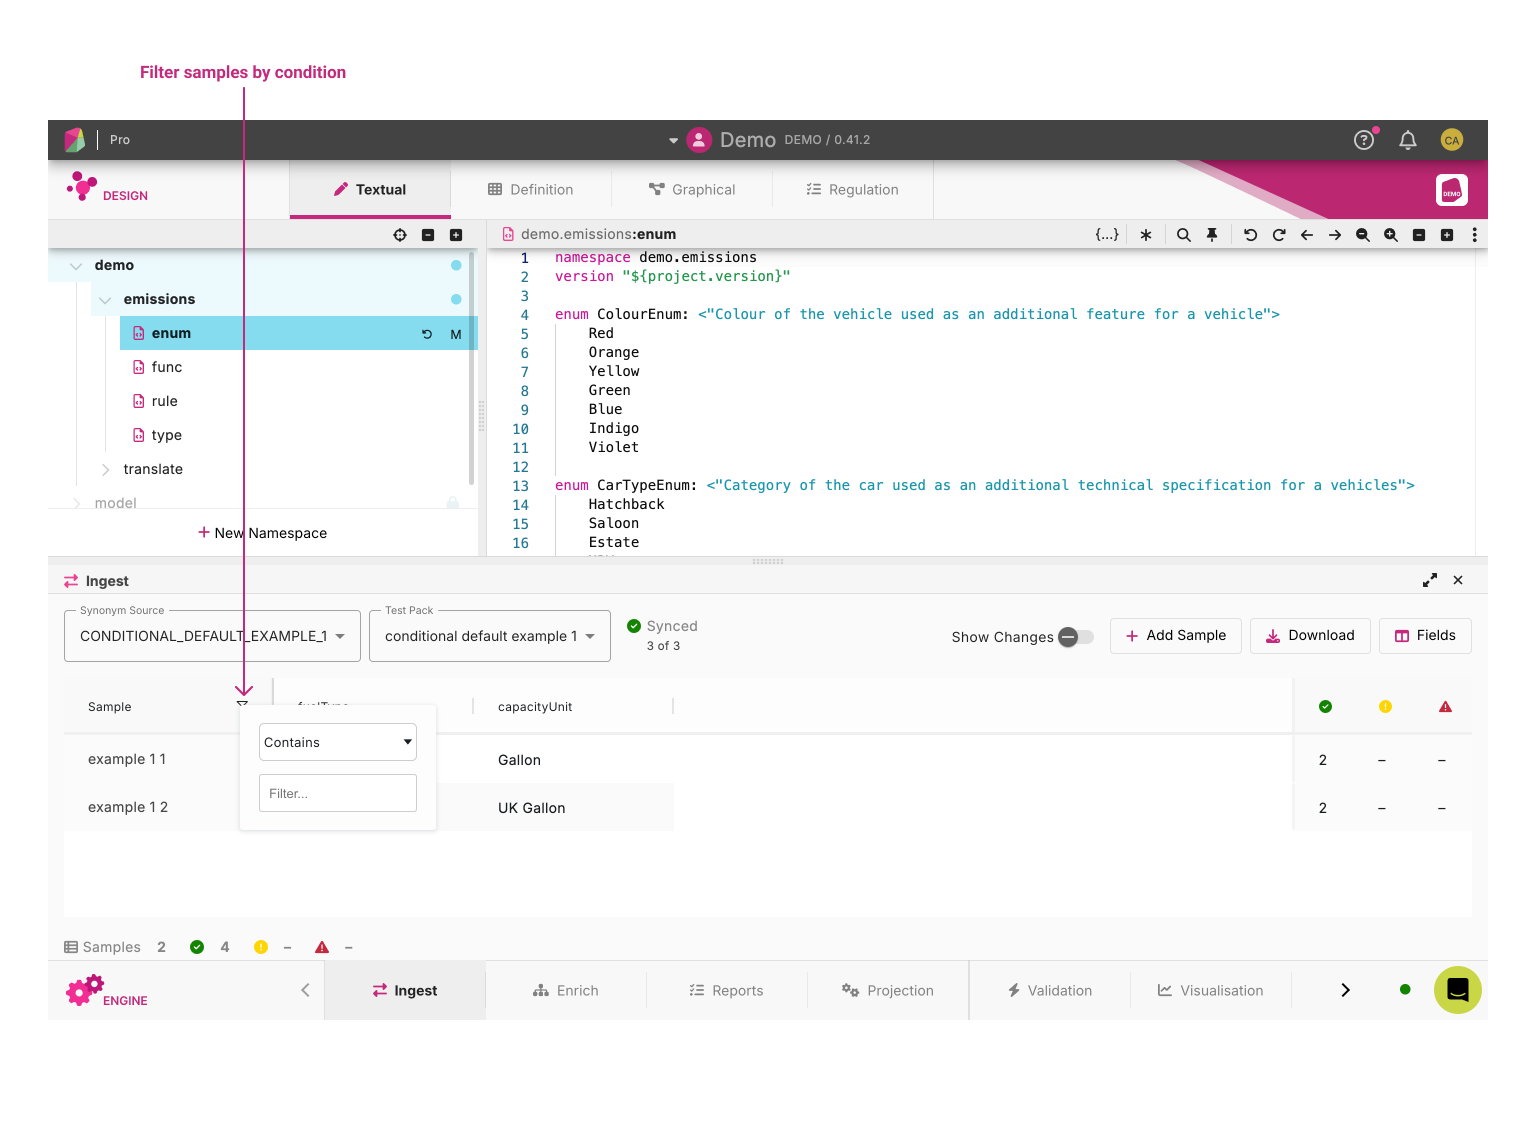
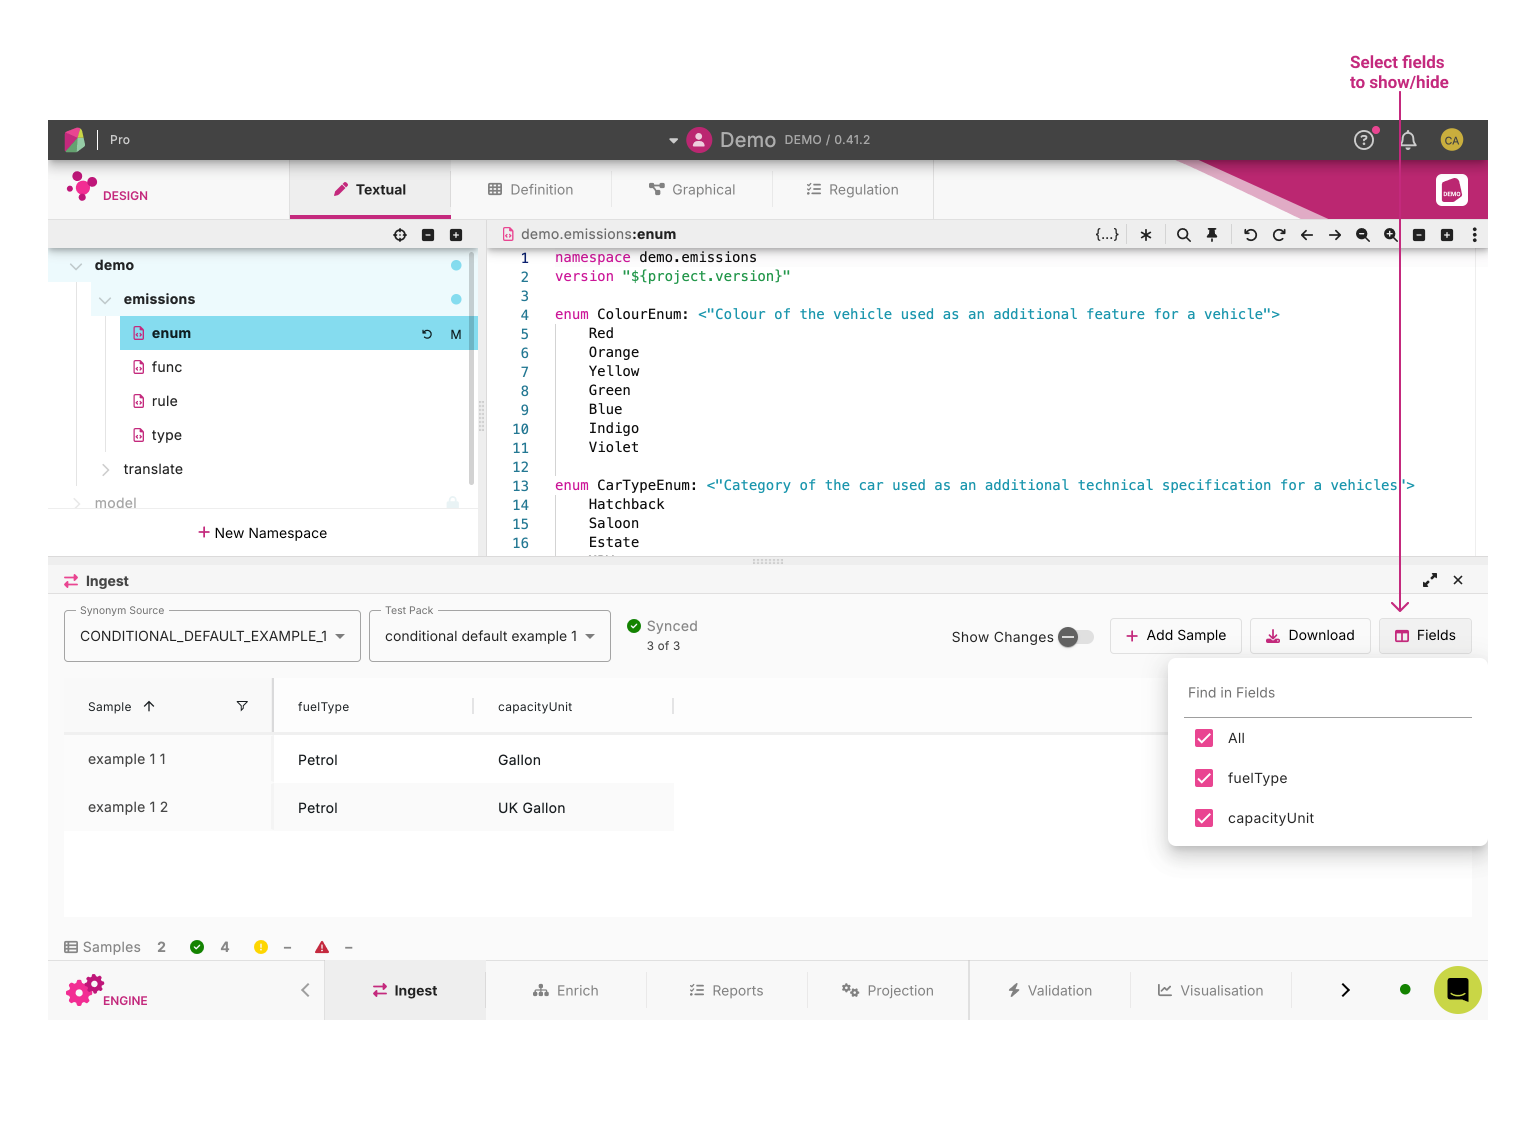
Users are able to filter by condition, or they can limit the field headings and show/hide available sample headings.
File Management 
Adding Samples 
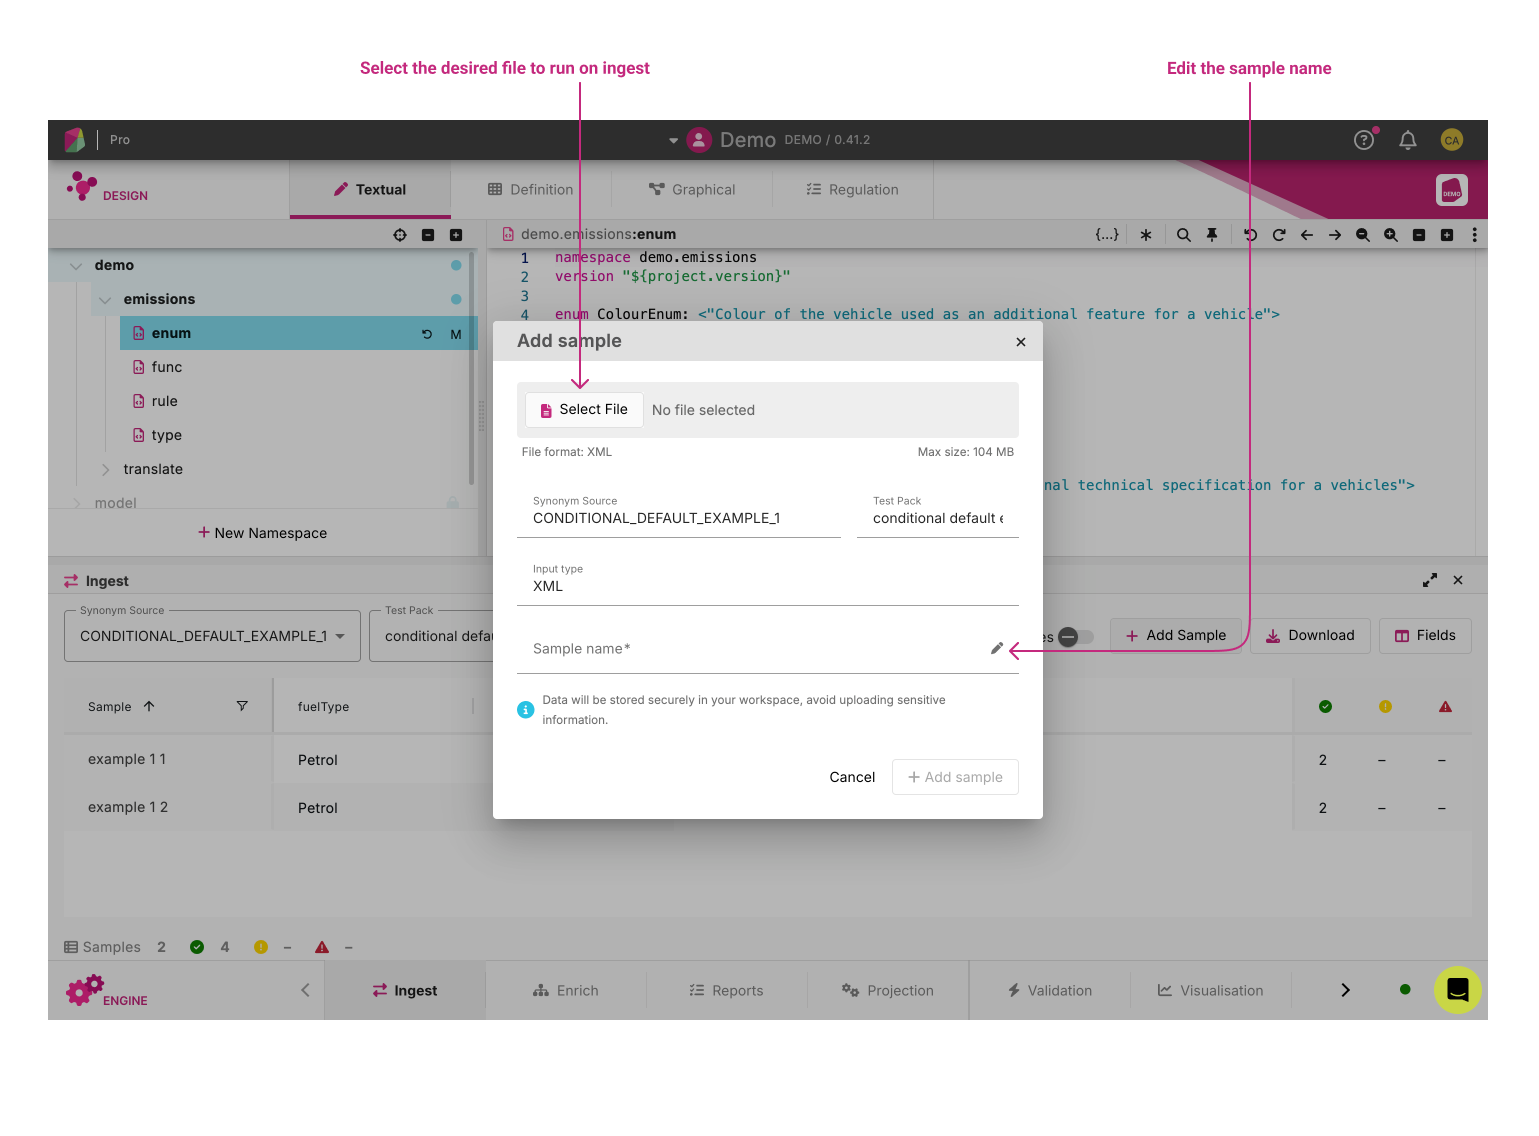
The Add Sample button lets you easily manage your samples:
- Drag and drop files directly
- Select multiple files from your device
- Create a new sample from scratch
Before adding samples, you can choose whether to include them in your workspace. Including them means they’ll be part of the workspace contribution.
Downloading Samples 
The Download button allows users to download all sample files for a selected test pack, as a csv file.
Running Ingestion 
Provided that all the required code in the user Workspace is ready to be run, the user can process files through Ingestion by selecting the synonym source and test pack. Ingestion will run automatically on the test packs.
Upon completion user will see a synced notice and the samples will render. Each run is cached, allowing users to quickly load up samples. Changes to the model or selecting a new synonym source will trigger a rerun of the ingestion files.
Viewing the results 
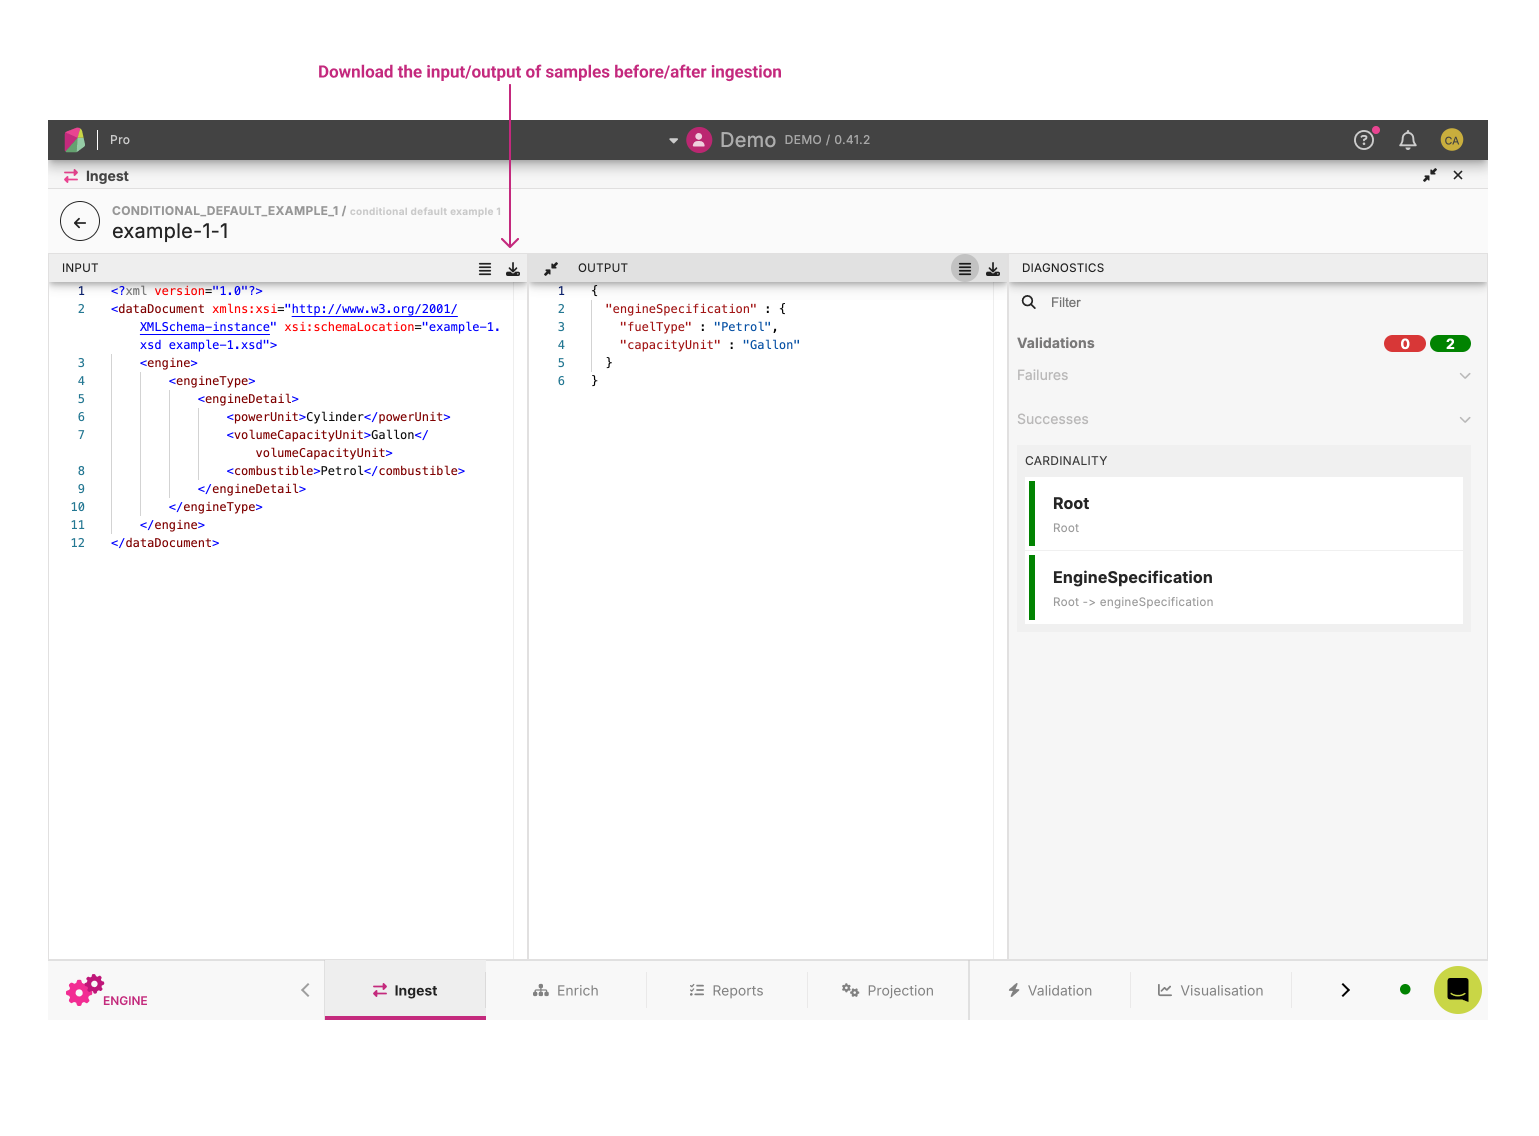
When a file has results, the user can click on a Sample File Row to open the Result Viewer.
Result Viewer 
The Result Viewer displays the results for a given sample file. It is split vertically into three panels, from left to right:
- Input File View panel: The Input File View corresponds to the input file used for Ingestion.
- Model Output View panel: The Model Output View corresponds to the output in the model format.
- Diagnostics panel: The Diagnostics panel displays statistics (Mapping, Validation) and other key information summarising the success (or failure) of ingesting the file.
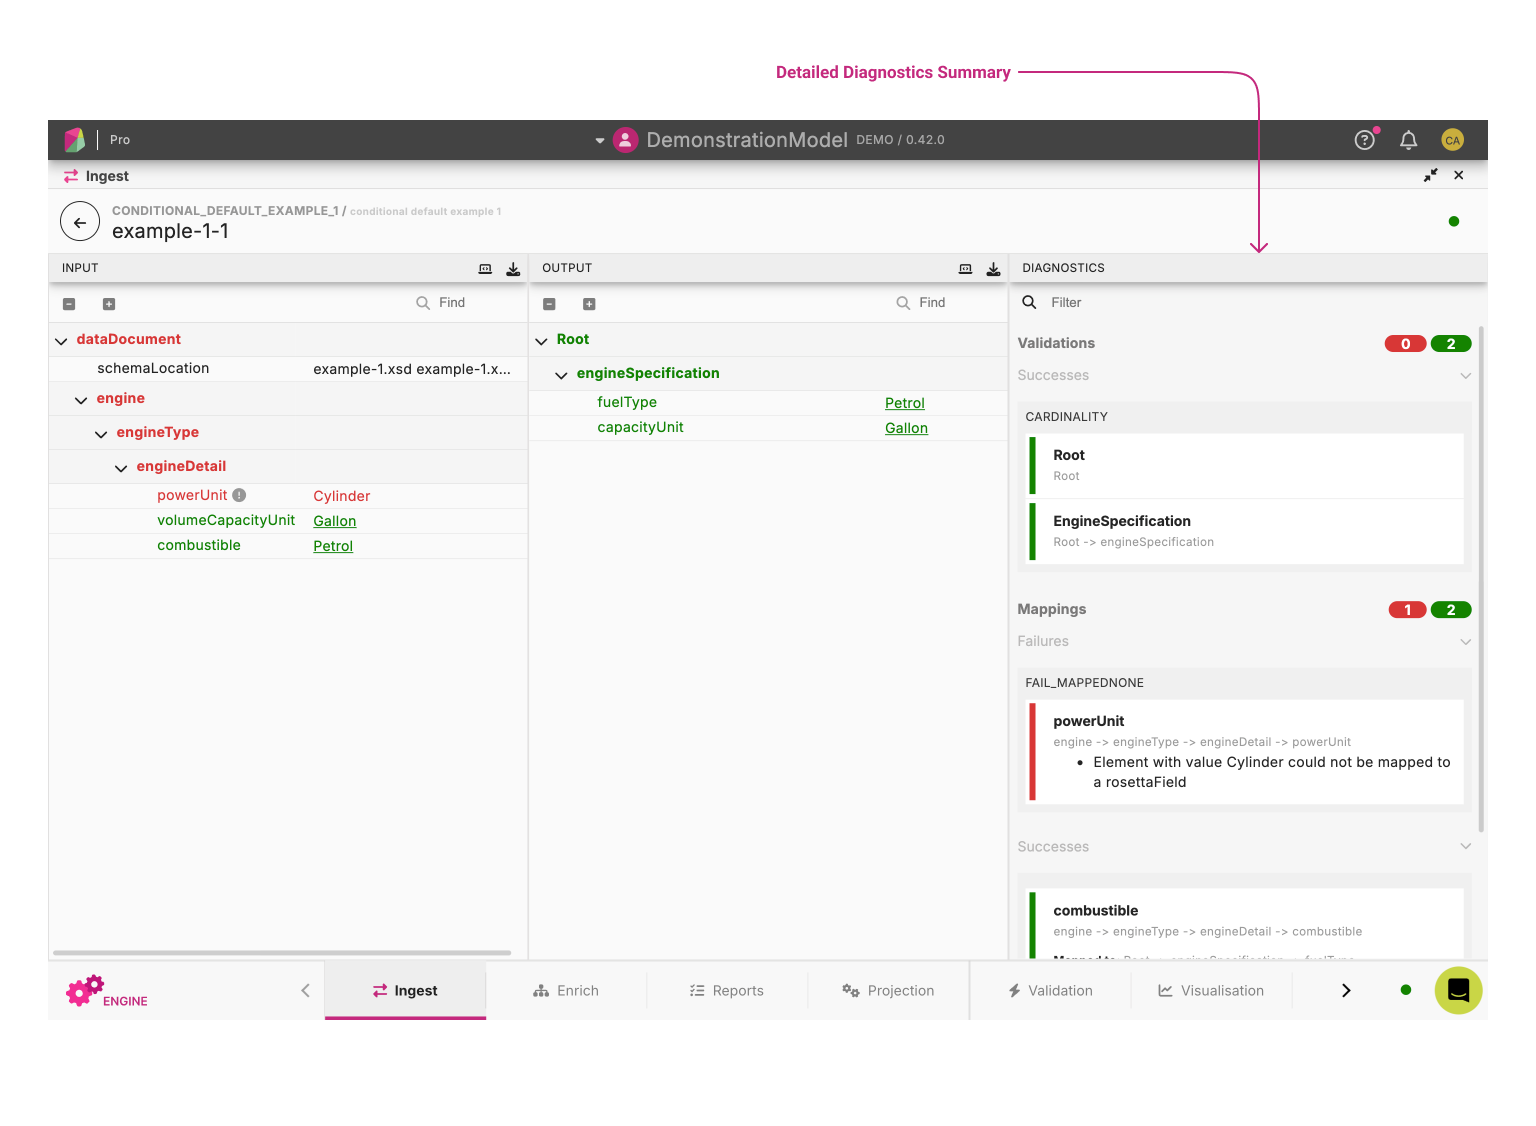
There are three panels:
Input
- The demo data document displayed in a tree view. You can view the XML by hitting the
view as codebutton
- The demo data document displayed in a tree view. You can view the XML by hitting the
Output
- The mapped document displayed in a tree view. You can view the JSON by hitting the
view as codebutton
- The mapped document displayed in a tree view. You can view the JSON by hitting the
Diagnostics
- The Diagnostics panel displays statistics (Mapping, Validation) and other key information summarising the success (or failure) of ingesting the file.
- Mapping: These are the number of paths in the source file that have mapped successfully to paths in the selected model.
- Success: The number of successfully mapped Rosetta fields.
- Failure: The number of failed mapping Rosetta fields.
- Validation: This result shows what percentage of validation rules passed for the qualified type.
- Success: The number of successful validations.
- Failure: The number of failed validations.
- Mapping: These are the number of paths in the source file that have mapped successfully to paths in the selected model.
- The Diagnostics panel displays statistics (Mapping, Validation) and other key information summarising the success (or failure) of ingesting the file.
View Modes 
Additionally, The Input File View and the Model Output View have two view modes:
- Formatted Document View: creates a tree structure which is colour coded to indicate the result of the Ingestion process as shown above.
- Code View: displays the file in its original mark-up format.
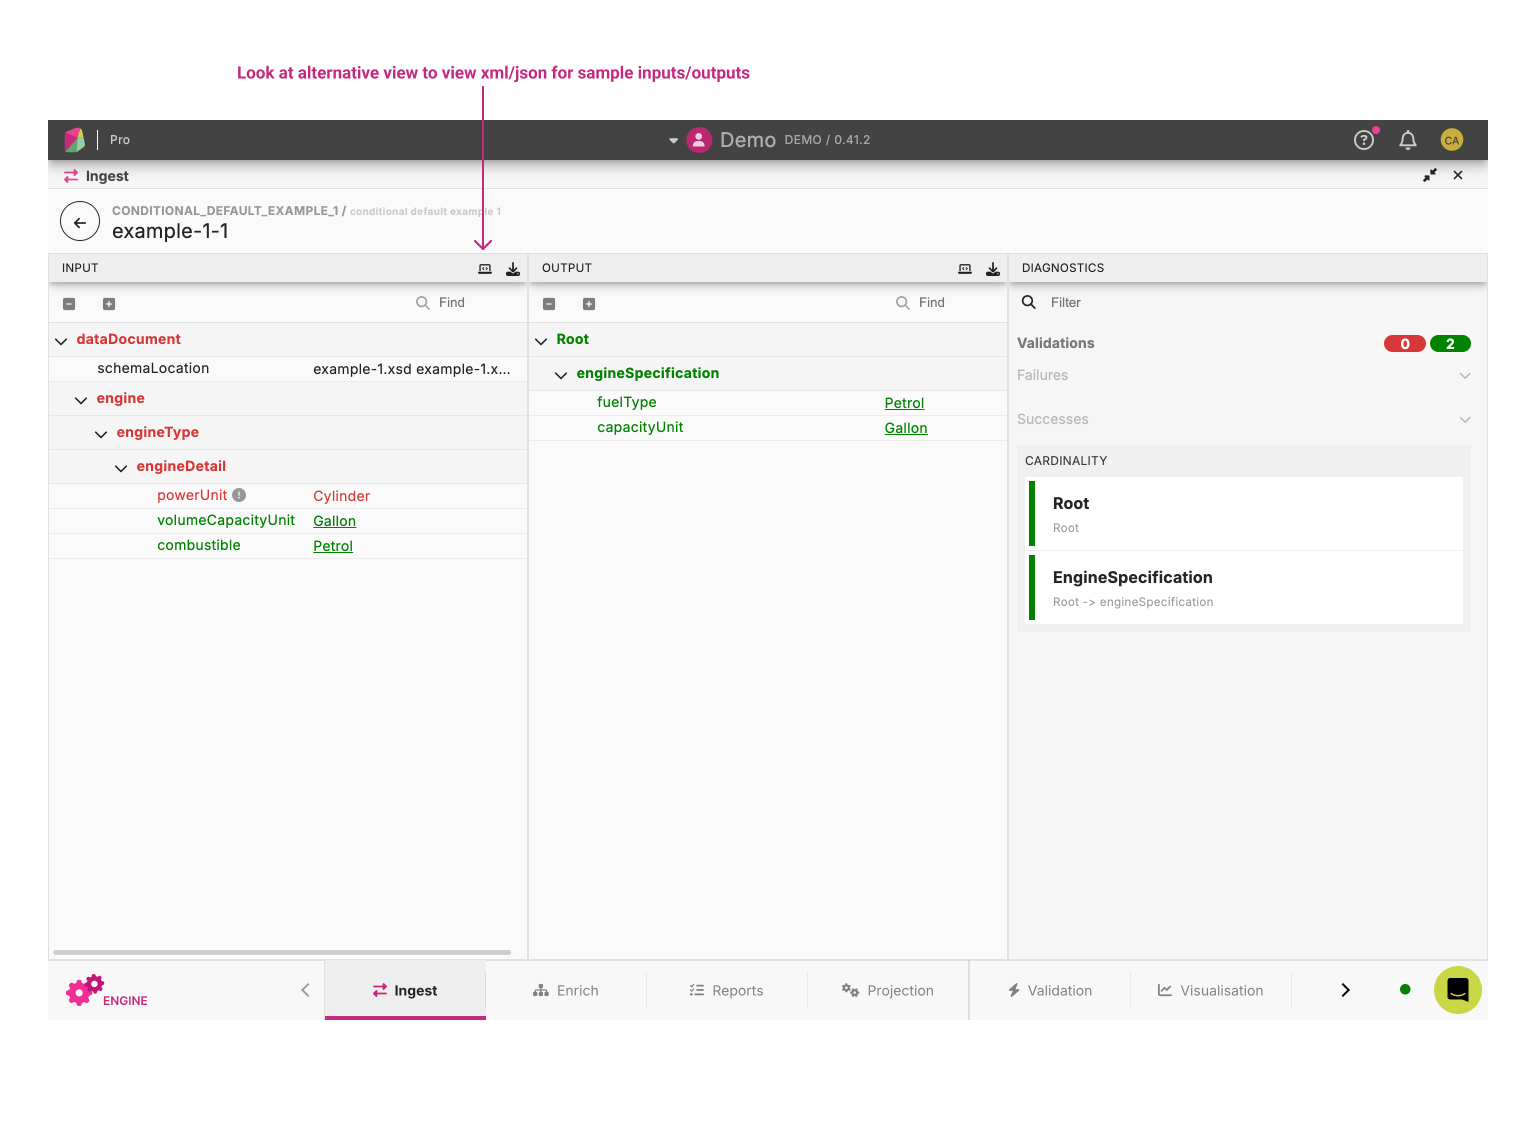
The Formatted Document View uses a list of colours to give mapping information between the input file and the model output
- Red: Invalid or unmapped values
- Dark Green: Mapped values
- Dark Green With underline: Mapped and linked values from input file to model output
- Light Green: Conditional values
- Yellow: Excluded values
- Black: No mapping data for these values
The code view displays the file in its markup format. This view currently supports both XML and JSON.
